Gain visibility into order volumes, lab test turnaround times, and account activity at a glance so you can focus on optimizing lab operations with confidence.
Optimize Operations with the Power of Visualized Data from Any Part of the lab.
Instant Insights from Any Dataset
Visualize operational metrics like turnaround time, rejected orders, or volume trends configured to match your lab’s workflows.
Reports Ready-to-Export
Download CSV reports for billing, compliance, infectious disease reporting, and more in just a few clicks.
Zero SQL Coding Required
Anyone on your team can explore data and customize dashboards without technical expertise.
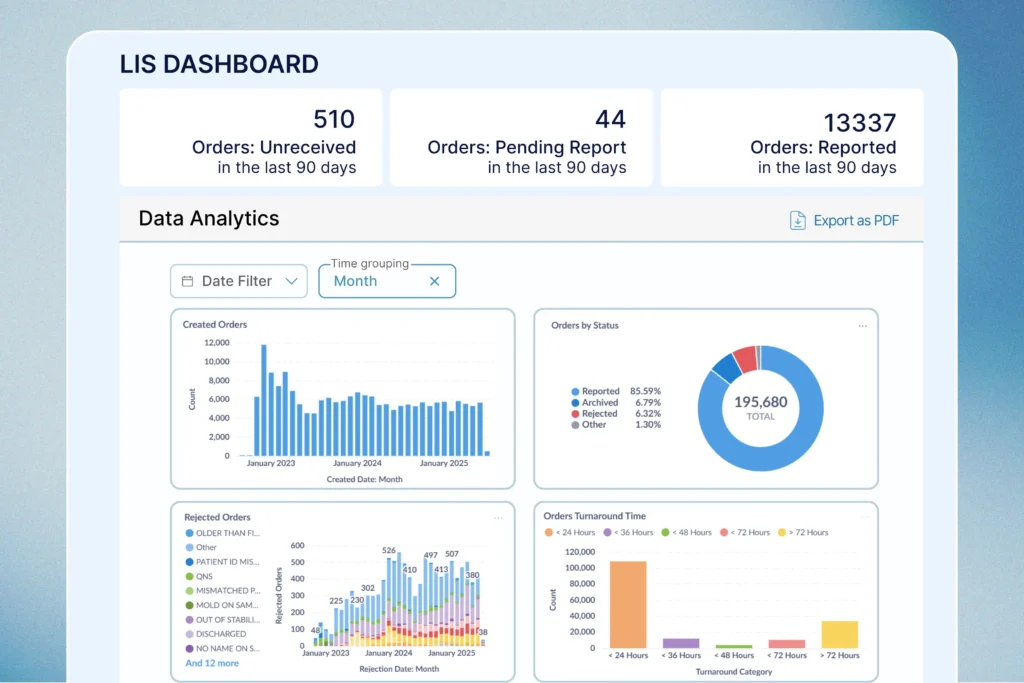
Interactive Analytics Dashboard
Dendi LIS’s analytics dashboard transforms raw LIS data into visual, customizable reports—no coding needed. Filter by test type, provider, location, date, or sample status to uncover trends and bottlenecks. Common dashboards include:
Order turnaround time by test
Rejected orders by reason
Monthly volume trends
Orders by status or workflow stage
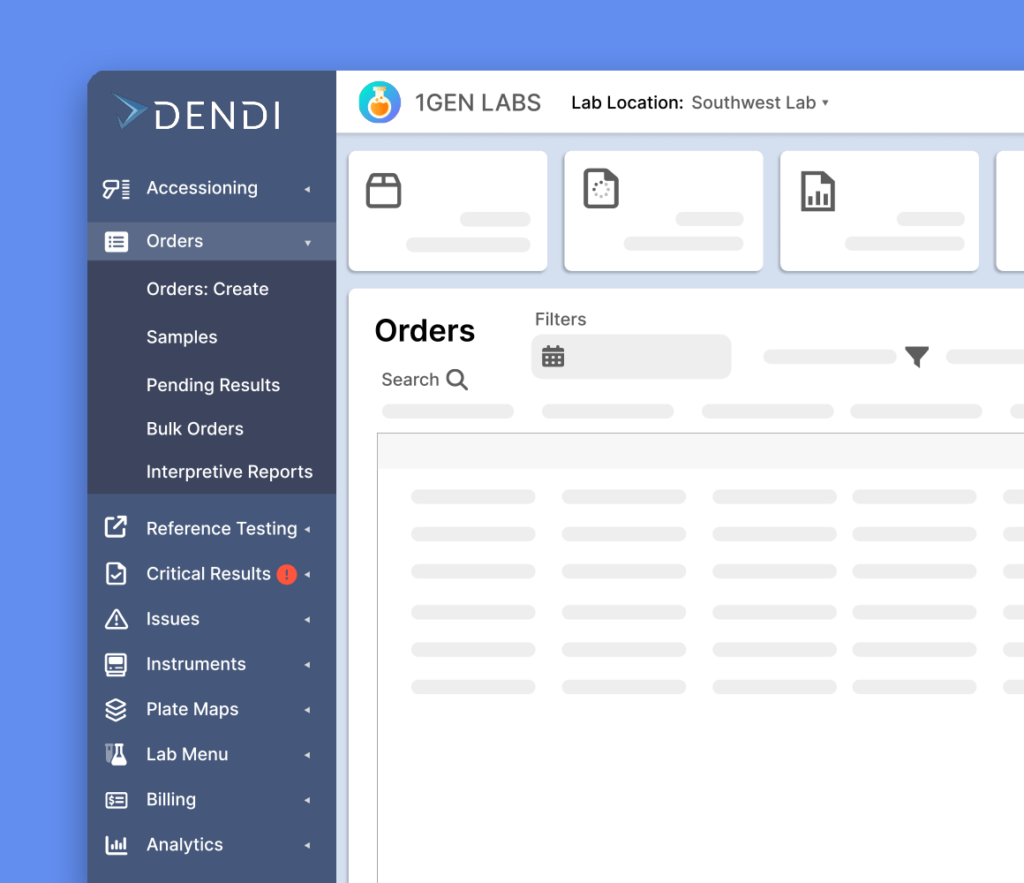
Configurable for Every Lab Workflow
Design dashboards for what matters most to your team Whether you’re tracking internal QC, monitoring instrument load, or reporting volumes by payer, every chart can be tailored to match your exact workflow. Users can adjust filters, change time intervals, and compare performance across accounts, sites, or instruments—all without writing a single line of code.
Powerful exports for finance, compliance, and ops Dendi makes it easy to pull the data you need—on demand or on schedule. Export CSVs filtered by any LIS data field for: